- Fatigue Technologies
- Constant Amplitude
- Fatigue Calculators
- Finders
- Technical Background
- Variable Amplitude
- Finite Element Model
- Multiaxial
- Probabilistic
- High Temperature
- Welded Structures
- Cast Iron
- Small Defect √ Area
- Utilities
- Languages
 日本語
日本語eFatigue gives you everything you need to perform state-of-the-art fatigue analysis over the web. Click here to learn more about eFatigue.
Glossary
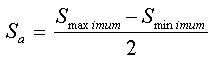
Alternating Stress (Sa)
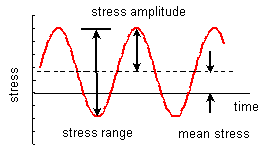
The alternating stress, Sa, is the amount the stress deviates from the mean. It is sometimes called the stress amplitude.
Cyclic Stress-Strain Curve
The materials deformation during a fatigue test is measured in the form of a hysteresis loop. After some initial transient behavior the material stabilizes and the same hysteresis loop is obtained for every loading cycle. Each strain range tested will have a corresponding stress range that is measured. The cyclic stress strain curve is a plot of all of this data.
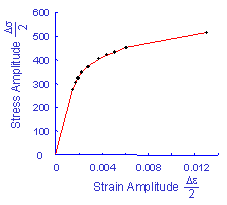
The curve describes the behavior of the material after it has been plastically deformed. This behavior is usually different than the initial behavior that is measured in a traditional tensile test. A simple power function is fit to this curve to obtain three material properties; cyclic strength coefficient, K' , cyclic strain hardening exponent, n' , and elastic modulus, E.
Endurance Limit (SFL)
Steel specimens tested in the laboratory exhibit a safe stress below which failure will not occur. This safe stress is called the endurance limit or the fatigue limit. This behavior is only found in steel. In aluminum alloys, a fatigue strength at 107 cycles is usually used in place of the fatigue limit. This is a stress which will produce failures in 107 cycles.
Fatigue Limit (SFL)
Steel specimens tested in the laboratory exhibit a safe stress below which failure will not occur. This safe stress is called the endurance limit or the fatigue limit. This behavior is only found in steel. In aluminum alloys, a fatigue strength at 107 cycles is usually used in place of the fatigue limit. This is a stress which will produce failures in 107 cycles.
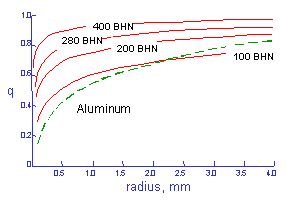
Fatigue Notch Factor (Kf)
Experiments have shown that the effect of small notches is less than that estimated from the traditional stress concentration factor, Kt. The fatigue notch factor, Kf, can be thought of as the effective stress concentration in fatigue. It depends on the size of the stress concentration and the material. Small stress concentrations are more effective in high strength materials. This effect is dealt with using a notch sensitivity factor, q.
Kf = 1 + (Kt - 1)q
The notch sensitivity factor q is an empirically determined constant that depends on the notch radius and material strength.
Fatigue Strength (SFL)
The stress required to produce failures in a specified number of cycles. In steel this is usually 106 cycles and is 107 cycles for welds and aluminum alloys. It is directly related to the strength of the material.
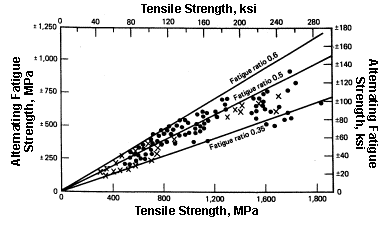
A useful approximation for the fatigue strength is one half the ultimate strength.
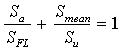
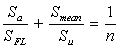
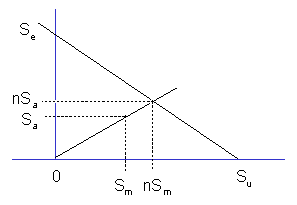
Goodman Diagram
Tension mean stresses reduce the fatigue life from that observed with completely reversed loading. The Goodman diagram, originally proposed in 1890, is a graphical representation of this effect.
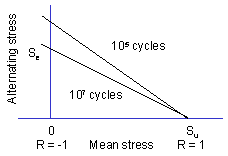
The alternating stress is plotted on one axis and the mean stress on the other. The allowable alternating stress with no mean stress is the fatigue limit. The maximum mean stress, with zero alternating stress, is the ultimate strength. A straight line is then drawn between the two points. Any combination of mean and alternating stress on this line will have the same fatigue life. Mathematically this may be expressed as:
Hysteresis Loop
The stress-strain response of a material that is cyclically loaded is in the form of a hysteresis loop.
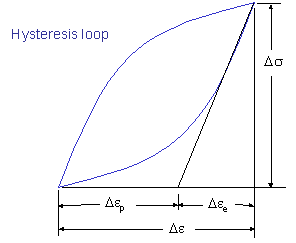
The hysteresis loop is often characterized by its stress range, Δσ, and strain range, Δε The strain range is often broken up into the elastic part and the plastic part.
Loading Factor (kL)
Historically, fatigue limits have been determined from simple bending tests where there is a stress gradient in the test specimen. A specimen loaded in tension will have a lower fatigue limit than one loaded in bending. An empirical correction factor, called the loading factor, is used to make an allowance for this effect.
| Loading Type | kL |
|---|---|
| Axial | 0.9 |
| Bending | 1.0 |
| Torsion | 0.57 |
Mean Stress (Sm)
The mean stress, Sm, is the average value of the stresses.

Neuber's Rule
Neuber's rule is used to convert an elastically computed stress or stain into the real stress or strain when plastic deformation occurs. For example, we may compute a stress with elastic assumptions at a notch to be KtS and this stress exceeds the strength of the material. The real stress will be somewhere on the materials stress-strain curve at some point σ.
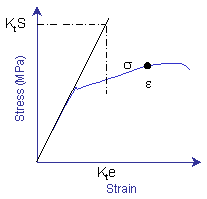
Neuber's rule states, with some mathematical proof, that the product of the elastic solution is equal to the product of the real elastic plastic solution. Mathematically this is expressed as
KtS⋅Kte=σ⋅ε.
Nominal Strain
The nominal strain is the strain away from any local stress concentrations.
Nominal Stress
The nominal stress is the stress away from any local stress concentrations.
Safety Factor
The safety factor is how much you want to underestimate the maximum strength of the materials in order to ensure a safe design. A single safety factor is applied to both the stress amplitude and the mean stress.
This can be graphically shown in the Goodman Diagram.
Size Factor (ksize)
Experimentally, larger parts have lower fatigue limits than smaller parts. Since the materials data is obtained from small specimens, a correction factor, called the size factor, is used for larger diameters. For non-circular sections an effective diameter is computed. The effective diameter is obtained by equating the volume of material subjected to 95% of the maximum stress to a round bar in bending with the same highly stressed volume.
Strain Amplitude
The strain amplitude is one half the strain range.
Strain Life Curve
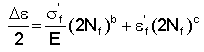
The strain life curve is determined by testing materials in strain control. The strain range is controlled and the corresponding stress range and fatigue life are determined. It is convenient to consider the elastic and plastic strain amplitudes separately when curve fitting the test data. Two data points are plotted for each test, one for the elastic strain amplitude vs life and another one for the plastic strain amplitude vs life.
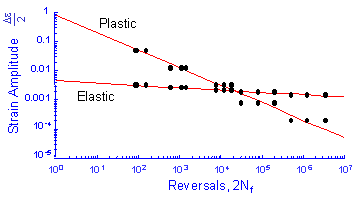
Test data is then fit to a simple power function to obtain the material constants; fatigue ductility coefficient,ε'f, fatigue ductility exponent, c , fatigue strength coefficient, σ'f , and fatigue strength exponent, b ,
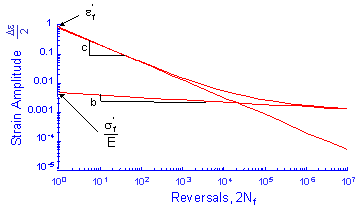
The total strain is then obtained by adding the elastic and plastic portions of the strain.
Strain Range (Δε)
The strain range, Δε, is the maximum strain minus the minimum strain in a cycle.
Stress Amplitude (Sa)
The stress amplitude, Sa, is the amount the stress deviates from the mean. It is sometimes called the alternating stress.
Stress Concentration Factor (Kt)
Stress concentrations arise from any abrupt change in the geometry of a part under load. As a result, the stress distribution is not uniform throughout the cross-section.
For example, is often necessary to drill a hole in a plate. When a load, P, is applied, the presence of the hole disturbs the uniform nominal stress in the plate.
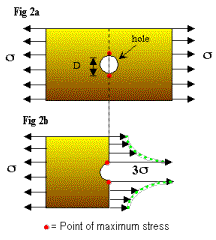
The profile of the stress in the cross-section through the center of the hole has the form shown in bottom of the figure. Notice that the maximum stress, σmax, is 3σ and occurs at the edge of the hole. The factor of 3 is known as the stress concentration factor, Kt. It can be seen from the figure that any stress values larger than σ are localized in a region with a diameter approximately equal to D.
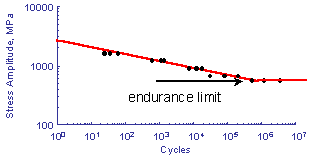
Stress Life Curve
The stress-life curve is a graphical representation of fatigue data. It represents the relationship between fatigue life, in cycles, and the applied stress amplitude.
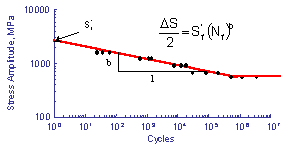
These data are often fit to a simple power function relating stress amplitude to fatigue life. The intercept, S'f, is taken at 1 cycle and the slope is denoted b. In the absence of actual test data, an approximation can be obtained from the ultimate strength, Su, of the material.
Sf' = 1.6Su and b = -0.085.
Stress Range (ΔS)
The stress range, ΔS, is the peak to peak stress.
Surface Finish Factor (KSF)
Fatigue limits are determined from small polished laboratory specimens. A surface finish correction is made to the fatigue limit of the material to obtain an estimate of the fatigue limit of the part in the condition it is actually being used.
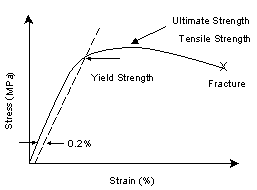
Ultimate Strength (Su)
The ultimate strength, Su, is also called the tensile strength. It is the maximum stress reached in an engineering stress strain diagram.