
eFatigue gives you everything you need to perform state-of-the-art fatigue analysis over the web. Click here to learn more about eFatigue.
Constant Amplitude Stress-Life Technical Background
The stress life method is the classical method for fatigue analysis of metals and has its origins in the work of Wöhler in 1850. Stresses in the structure or component are compared to the fatigue limit of the material. The basis of the method is the materials S-N curve which is obtained by testing small laboratory specimens until failure.
Material Properties
Historically, these tests have been conducted in rotating bending. Today, it is often common to find test data for axial loading as well.
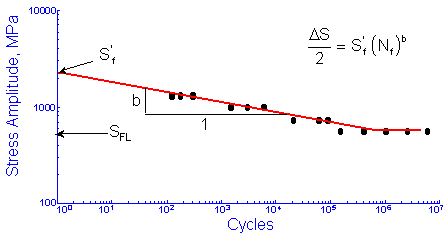
The fatigue limit, SFL, is the stress below which failures do not occur in the laboratory. Wöhler called this a safe stress level for design. Today we know that failures will occur below the safe stress level but it will take a very large number of cycles, longer than the 106 or 107 cycles used in normal fatigue testing. The finite life portion of the curve is fit to a power function relating the stress amplitude, ΔS/2, and fatigue life in cycles, Nf. Be careful, some people use reversals, 2Nf, instead of cycles for plotting fatigue data. There are 2 reversals in one cycle. The intercept at 1 cycle, Sf', and slope, b, are taken as material constants.
Many times the fatigue behavior of a material are unknown and must be estimated from the tensile properties. There is a strong correlation between fatigue strength and tensile strength.
(From Forrest, Fatigue of Metals, Pergamon Press, London, 1962)
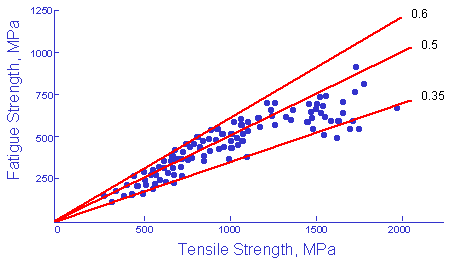
The fatigue limit is approximated as one half of the tensile strength.

Many metal alloys are heat treatable and the hardness rather than the tensile strength are known. Another well known approximation, with just as much scatter as shown above, is that the tensile strength, in English units of ksi, is approximately one half of the Brinell hardness, BHN. Combining these two approximations provides an estimate of the fatigue strength from the hardness.

It has been observed that the fatigue strength at 1000 cycles is approximately 0.9 Su. This gives two points on the SN curve, both in terms of hardness that can be used to estimate the entire SN curve.

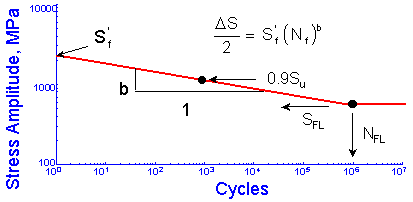
Four material parameters are used to describe the materials stress life curve, Sf', b, SFL and NFL , only three of which are independent. Leaving any one of the parameters blank will result in the fourth one being directly computed. If all four are entered, SFL will be ignored.
Modifying Factors
Materials, as they are tested, are always in a different condition (surface finish, residual stress, etc.) from the materials as they are actually used. An important part of the analysis is to "correct" the basic materials data to obtain an estimate of the fatigue limit of the material in the component or structure of interest. Fatigue cracks usually nucleate on the surface so that the condition of the surface plays a major role in the fatigue resistance of a component. Test specimens are polished to eliminate the effects of surface finish. The degree of surface damage depends not only on the processing but also on the strength of the material. Higher strength materials are more susceptible to surface damage. To account for this in the analysis the material fatigue limit is reduced by a surface finish factor, kSF.
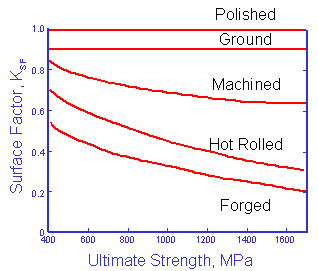
The original data for constructing this curve is shown below. The factors tend to provide conservative estimates for fatigue lives.
(From Noll and Lipson, "Allowable Working Stresses", Society for Experimental Stress Analysis, Vol. III, no. 2, 1949)
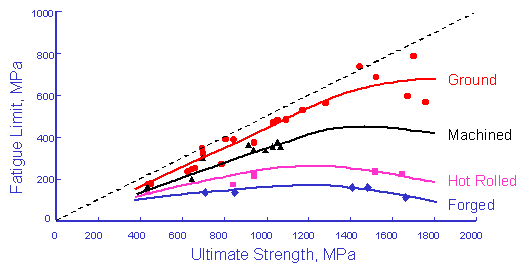
These data are fit to a simple power function to obtain an estimate of the surface factor for any hardness steel.

| α | β | |
| Ground | 1.58 | -0.085 |
| Machined | 4.51 | -0.265 |
| Hot Rolled | 57.7 | -0.718 |
| Forged | 272 | -0.995 |
Fatigue limits have historically been determined from small specimens, 6 mm in diameter, tested in rotating bending. High strength materials tested in tension tend to have lower fatigue limits. An empirical load factor, kL, is introduced for other types of loading.
| kL | |
| Tension, Su <= 1500 MPa | 0.92 |
| Tension, Su > 1500 MPa | 1.0 |
| Bending | 1.0 |
| Torsion | 0.58 |
Experiments show that smaller components tend to have higher fatigue limits than larger ones. This is accommodated in the analysis by introducing a size factor, ksize. Some people call this a gradient factor. One of the most widely used corrections is based on the diameter of a bar.

One of the problems associated with this simple approximation is what to do when the section is not round. This problem is overcome by defining an effective diameter. The volume of material subjected to 95% of the maximum stress in any shaped cross section is equated to a round bar of the same highly stressed volume. When these volumes are equated, the length canceled and the ratio becomes one of the relative areas. If we define the cross sectional area of a non-circular section subjected to 95% of the maximum stress as A0.95, then the effective diameter is given by

Once these correction factors are determined, the fatigue limit of the machine component in the condition that it is being used in can be evaluated from the standard test specimen.

These generalized empirical factors have the greatest confidence when applied to steel because they were all derived from on extensive database on steel accumulated from over 100 years of testing. The figures above have shown considerable scatter in the test data so that the factors must be regarded as approximate and are no substitute for actual test data for a critical application. That said, they do provide a good first approximation when no test data is available.
Stress Concentrations
Stress concentrations are one of the most important factors affecting the fatigue life of any component or structure. These stress concentrations may be intentional in the design or unintentional such as deep machining marks or other processing related flaws. It seems reasonable to directly compare the maximum stress at a stress concentration to the estimated fatigue limit for that component.
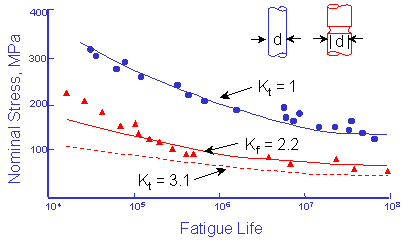
(From MacGregor and Grossman, "Effects of Cyclic Loading on Mechanical Behavior of 24S-T4 and 75S-T6 Aluminum Alloys and SAE 4130 Steel", NACA TN 2812, 1952)
Test data for an unnotched bar, such as the one above pictured in blue, are plotted as blue circles. This geometry has a stress concentration factor, Kt, equal to 1. The red dashed line represents estimated data for a geometry that has a stress concentration factor of 3.1, such as the notched bar pictured in red. The presence of the notch reduces the allowable nominal stress amplitude at any fatigue life by a factor equal to Kt. Notice that all of the actual test data, red triangles, lie above this estimate. This is because the effective stress concentration in fatigue is less than that predicted by the stress concentration factor, Kt. This effective stress concentration factor is called the fatigue notch factor, Kf. The variation between Kf and Kt is dependant on the size of the notch and strength of the material. A material that is very sensitive to notches will have Kf equal to Kt. If the material is very insensitive to notches, Kf will be close to 1. A notch sensitivity factor, q, is introduced to quantify this sensitivity.
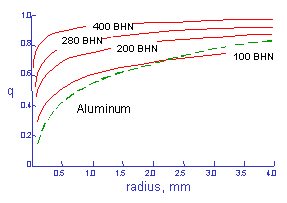
(From Peterson "Notch Sensitivity", Metal Fatigue, Sines and Waisman, McGraw Hill, 1959)
Smaller radii are less effective in fatigue than larger ones. Fatigue notch factors can be computed from Kt and q.

Peterson fit the available test data for steel and aluminum to obtain an expression for Kf in terms of ultimate strength, Su, and notch radius, ρ in mm.

Plastic deformation reduces the effect of a stress concentration at shorter lives. The fatigue notch factor becomes smaller as the lives become shorter. In ductile materials, stress concentrations play only a small role in determining the overall strength of the structure. One unfortunate consequence of this is that static strength testing often provides little information about the likely fatigue performance of a component. An estimate of the notched component SN curve may be obtained dividing the materials fatigue strength, including any modify factors, at 106 cycles by Kf and drawing a line to the unnotched fatigue strength at 1 cycle.
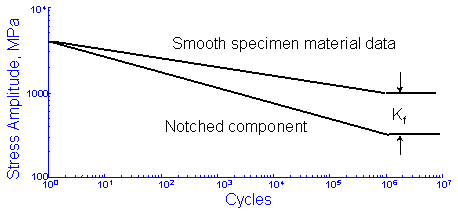
This has the effect of changing the slope of the material's SN curve and leaving the intercept unchanged. If we include the modifying factors this new slope, bnotch, can be computed as

and the new notched SN curve will be given by

Mean Stresses
Tensile mean stresses are known to reduce the fatigue strength of a component. Compressive mean stresses increase the performance and are frequently used to increase the fatigue strength of a manufactured part. The most common method for accounting for mean stresses is the Goodman Diagram. It was first proposed in 1890. Goodman writes ".. whether the assumptions of the theory are justifiable or not.... We adopt it simply because it is the easiest to use, and for all practical purposes, represents Wöhlers data." The fatigue limit for zero mean stress is plotted on one axis and the ultimate strength on the other.
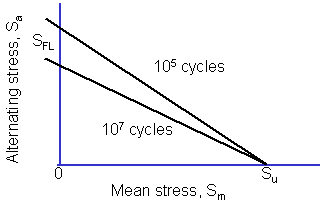
The diagram can be described by

Stress concentration effects can be directly included in the Goodman diagram.

For finite lives, an equivalent completely reversed stress, Seq, is computed and compared with the component SN curve.

Here Kf is used to modify the mean stress but not the stress amplitude because stress concentration effects are already included in the component SN curve.
Direct use of these equations poses problems for situations involving high mean stresses or in situations that result in short fatigue lives. This problem is caused by the calculated elastic stress being higher than the actual stress and in some cases even higher than the ultimate strength. A preloaded bolt is a good example. A common way to overcome this problem is to apply the stress concentration factor only to the alternating stress and not to the mean stress. This has the potential to lead to nonconservative estimates at long lives with moderate mean stresses. Plastic deformation limits the stress around a stress concentration to some value between the yield and ultimate strength of the material. A more reasonable method is to apply the stress concentration factor to both mean and alternating stresses and then made a correction to the maximum stress Kf ( Sa + Sm ) when it exceeds the material's yield strength. The maximum stress should be limited to about 80% of the ultimate strength.