eFatigue gives you everything you need to perform state-of-the-art fatigue analysis over the web. Click here to learn more about eFatigue.
Plotting Results in FEA Viewers
ANSYS Files
To make a fatigue life contour plot in ANSYS perform the following steps.
1. Download the eFatigue results file you wish to plot. It will have a .rst extension
2. Run ANSYS Classic. The .rst file that was created will not plot in ANSYS Workbench.
3. From ANSYS Main menu pick the General Postproc menu item Results Viewer.
This will request the .rst filename, pick the file of interest.
4. On toolbar there will be a series of combo/drop-down boxes. On the left hand one select Element Solution -> Stress -> X Component of Stress.
The component will depend upon which life contour you wish to plot. eFatigue replaces the stress with the fatigue life in the .rst files for plotting.
5. Press the Plot Results tool.
This is first tool on toolbar after drop-down boxes.
A sample lowest life (Sx) plot is shown below:
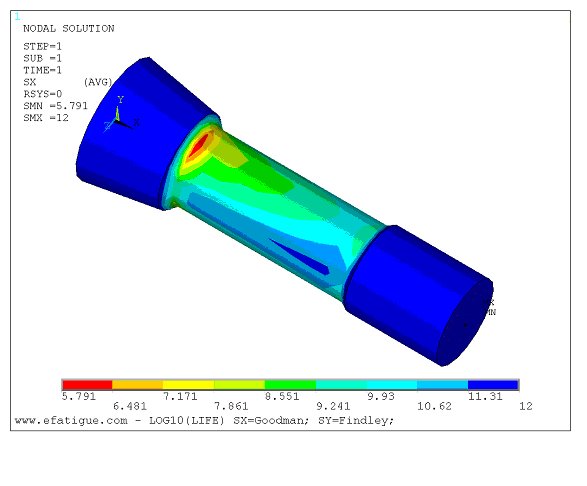
LOG10(life) is plotted. Ignore the negative sign in the scale. It is only used to set the plot colors.
ABAQUS Files
The ABAQUS viewer does not support contouring of .fil files. You should load the .fil file like any structural results into your standard .fil viewer.
A sample lowest life Plot (Sx) plot is shown below
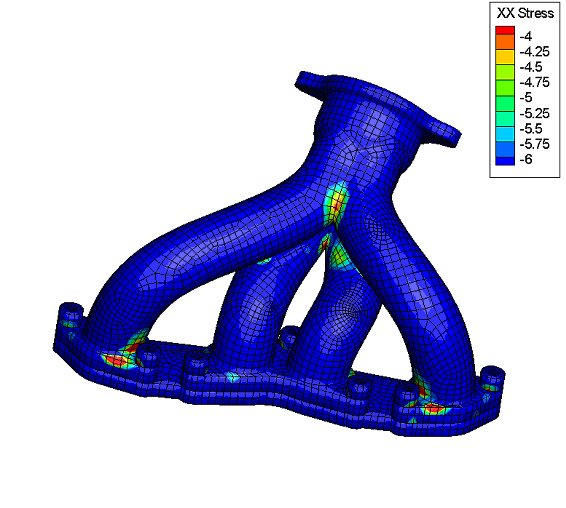
LOG10(life) is plotted. Ignore the negative sign in the scale. It is only used to set the plot colors.