- Fatigue Technologies
- Constant Amplitude
- Variable Amplitude
- Finite Element Model
- Multiaxial
- Probabilistic
- High Temperature
- Welded Structures
- Cast Iron
- Small Defect √ Area
- Fatigue Calculators
- Finders
- Technical Background
- Utilities
- Languages
 日本語
日本語eFatigue gives you everything you need to perform state-of-the-art fatigue analysis over the web. Click here to learn more about eFatigue.
Small Defect Technical Background
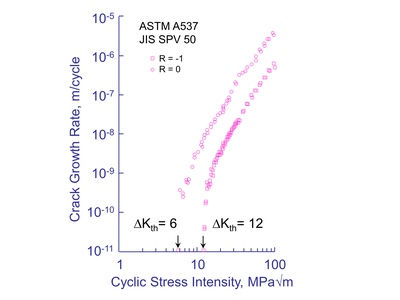
The crack growth rate is often assumed to linearly depend only on the applied stress intensity, ΔK, adjusted for any mean stress or R ratio effects. The crack growth rate for a structural steel ( JIS SPV50/ASTM A537 ) is shown below for two R ratio's. Be careful, there is some confusion as to how to compute the stress intensity for compression loading. One viewpoint is that only the tensile portion of the loading cycle should be used to compute the stress intensity factor when R < 0 because the stress intensity has no theoretical meaning for compression loading. When dealing with small defects it is more common to adopt the other viewpoint that the entire stress range should be used to compute the stress intensity. A threshold stress intensity, ΔKth, is observed where cracks grow at very small rates. As a point of reference, a growth rate of 10-10 m/cycle represents growth of less than 1 atom per cycle.
For all practical purposes, a crack is assumed to not grow below the threshold stress intensity just like a material is assumed not to fail at stresses below the fatigue limit, σfl. These two concepts can be combined to obtain an estimate of the size of a flaw, ao, that would not influence the fatigue strength of a material or a component.
This can be shown graphically in the following figure.
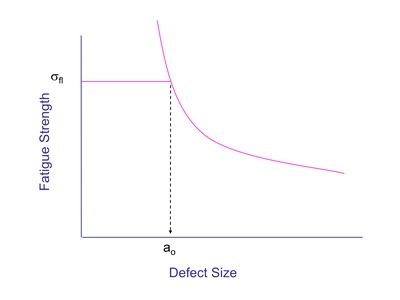
The fatigue strength increases with decreasing defect sizes. Fracture mechanics predicts that this increase in fatigue strength will continue and tend towards infinity as the crack size approaches zero. But the fatigue strength of a component can not be greater than the fatigue limit of the material. Cyclic loading results in the nucleation of small microcracks. External flaws that are smaller than naturally nucleating microcracks will not influence the fatigue strength.
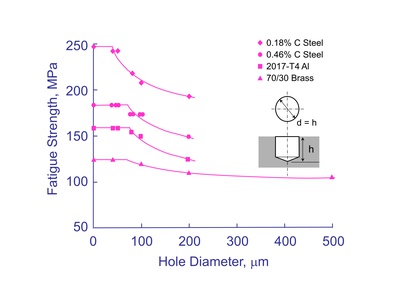
Murakami confirmed this effect by investigating the effect of small holes on the fatigue strength for several materials. Results are shown below where a plateau is followed by a reduction in the fatigue strength as the hole size increases.
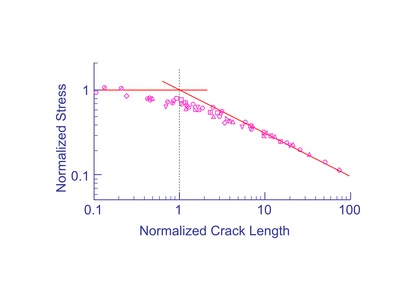
Kitagawa investigated the behavior of small cracks near the fatigue limit of the material and noted a reduction in fatigue strength for flaw sizes less than ao. His data is shown below. To compare materials the stress has been normalized by the fatigue limit and crack length by ao. These diagrams are now called Kitagawa or Kitagawa-Takahashi diagrams showing the influence of small flaws. The threshold stress intensity for small flaws is lower than that obtained from a traditional crack growth test with large cracks.
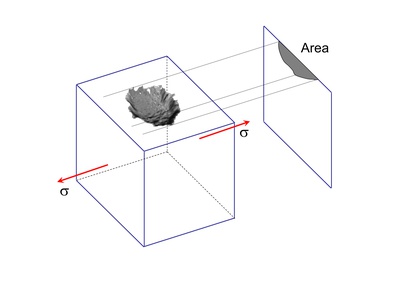
Murakami systematically studied the influence of small defects on the fatigue strength. It is often difficult to determine the size of a small natural defect such as a corrosion pit or porosity in a casting. He introduced the concept of √ Area to provide a quantative, yet simple, measure of defect sizes. It is the square root of the projected area of a flaw perpendicular to the loading direction. This concept is illustrated below.
The relationship between the threshold stress intensity factor and defect size measured by √ Area is shown below for many materials. The different symbols represent the Vickers hardness of the matrix material. The dependence of threshold stress intensity on crack size is clearly shown. Note that the threshold stress intensity does not depend on the crack size for a long crack greater than a few millimeters. The threshold stress intensity decreased with decreasing crack sizes so that using the long crack threshold stress intensity is nonconservative. This data was obtained with R = -1 and ΔKth was computed from the full stress range.
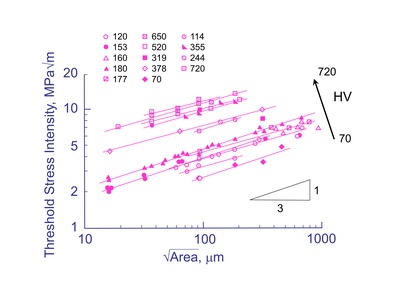
This data can be normalized by dividing ΔKth by the Vickers hardness, HV. Traditionally the Vickers hardness number is reported in units of kgf/mm2. Recently, HV can also be reported in units of MPa. ( 9.8 HV(kgf/mm2) = HV(MPa) ). Here we use kgf/mm2 units.
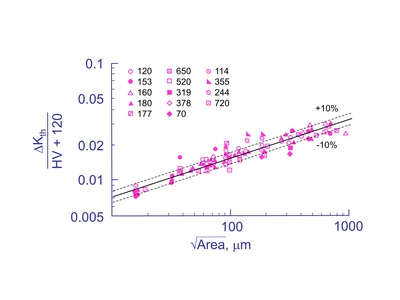
Least squares fitting results in the following expression for the threshold stress intensity as a function of the Vickers hardness of the matrix.
Here √ Area is measured in μm resulting in ΔKth with units of MPa√ m . From a practical viewpoint, we are interested in the allowable stresses on a component, not the threshold stress intensity. Given a flaw with a size √ Area , matrix hardmess HV, and stress ratio R we can directly compute the allowable stress amplitude, σa.
Alpha is a mean stress sensitivity factor defined by α = 0.226 + HV×10-4. Applied stresses are given by