eFatigue gives you everything you need to perform state-of-the-art fatigue analysis over the web. Click here to learn more about eFatigue.
Glossary
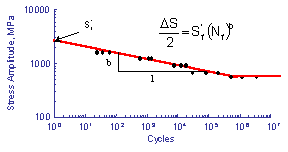
Stress Life Curve
The stress-life curve is a graphical representation of fatigue data. It represents the relationship between fatigue life, in cycles, and the applied stress amplitude.

These data are often fit to a simple power function relating stress amplitude to fatigue life. The intercept, S'f, is taken at 1 cycle and the slope is denoted b. In the absence of actual test data, an approximation can be obtained from the ultimate strength, Su, of the material.
Sf' = 1.6Su and b = -0.085.
 日本語
日本語