
eFatigue gives you everything you need to perform state-of-the-art fatigue analysis over the web. Click here to learn more about eFatigue.
Probabilistic Statistical Distributions Technical Background
There are a large number of statistical distributions available. Statistical distributions are described by a probability density function, fx(X). The probability density function, pdf, for a uniform distribution is given below. The probability of a value X occurring in an interval x � e is obtained by integrating the fx(X).
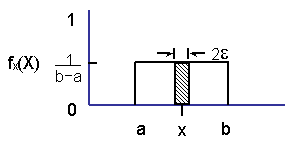

Equations of the probability density functions are given in standard forms. Scale and location parameters are then used with the standard functions to obtain the distribution of interest. For example, the normal distribution has a standard form with two parameters. The location parameter is the mean and the scale parameter is the standard deviation. In all other distributions, the scale and location parameters are related to but not equal to the mean and standard deviation.
The mean value, mx is the central tendency of the data, i.e. the average value.

The median value corresponds to a probability of 50%, i.e. half of the data is above the median and half is below. In a symmetric distribution such as a normal, the mean and median are the same. In a log-normal distribution they are not because the log of the mean is not the same as the mean of the logs.
The dispersion in the data is given by the variance

from which the standard deviation, sx, is computed.

The coefficient of variation COV is useful when comparing different distributions.

Normal
Normal distributions are frequently used for dimensions and stress concentration factors. The probability density function is given by
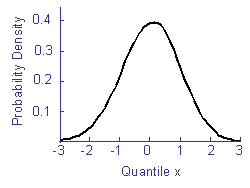

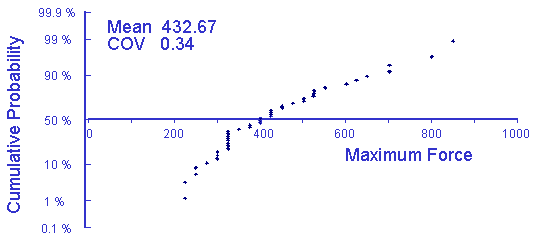
The distribution is characterized by the mean, m, and standard deviation, s. A Normal probability plot of the maximum force among several drivers is given below.
Log-Normal
Log-Normal distributions are frequently used for material properties and fatigue lives. Log-Normal distributions are the same as a normal distribution of the logs. The probability density function is given by
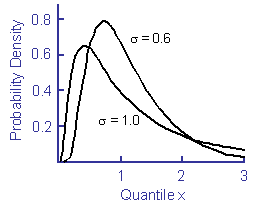


The mean of the logs is m and the median is m. The standard deviation is given in terms of the log. A Log-Normal probability plot of the maximum force among several drivers is given below.
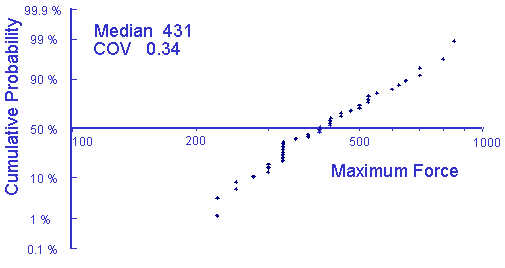
Some useful relationships between the log and linear domains are given below.
mean of x: 
COV of x: 
mean of ln x: 
std of x: 
median of x: 
Uniform
Uniform distributions are frequently used to characterize uncertainty where any value within some range is equally likely. The probability density function is given by
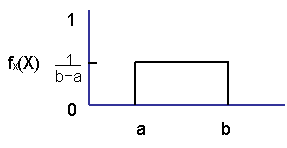

The location parameter is the mean value.

The scale parameter, s, is computed from a and b.

Gumbel
The Gumbel distribution is a type I extreme value distribution and is used to determine the largest extremes. It is suitable for describing the maximum loads in a loading history. The probability density function for this distribution is given by
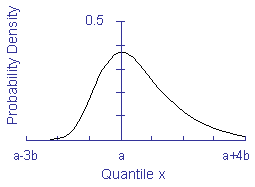

The distribution is characterized by a scale parameter a and a location parameter b > 0. A Gumbel probability plot is shown below for the maximum load among several drivers.
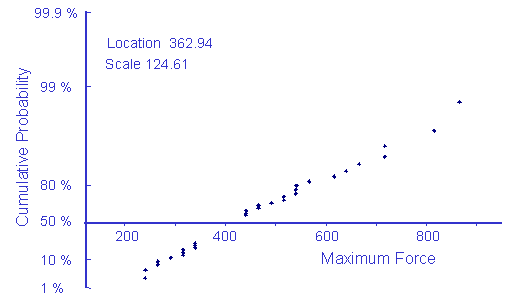
The scale parameter b can be estimated from the variance

The location parameter a can be estimated as the value of x corresponding to a cumulative probability of 36.8%
Weibull
Weibull distributions are used when the minimum values are of the greatest importance. The probability density function is given by
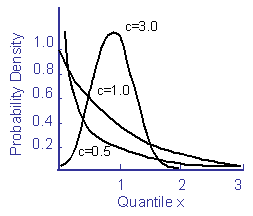

Weibull distributions are characterized by a scale parameter b and a slope c. A Weibull probability plot is shown below for the maximum load among several drivers.
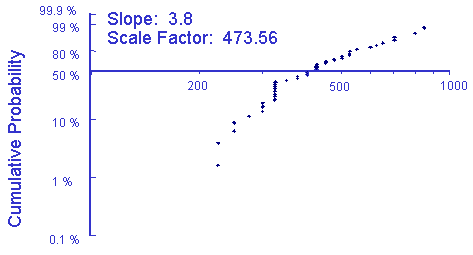
The scale parameter b can be estimated as the value of x corresponding to a cumulative probability of 63.2%. The slope is the best fit slope on Weibull probability plots.
 日本語
日本語